Types of Groups
Types of Groups
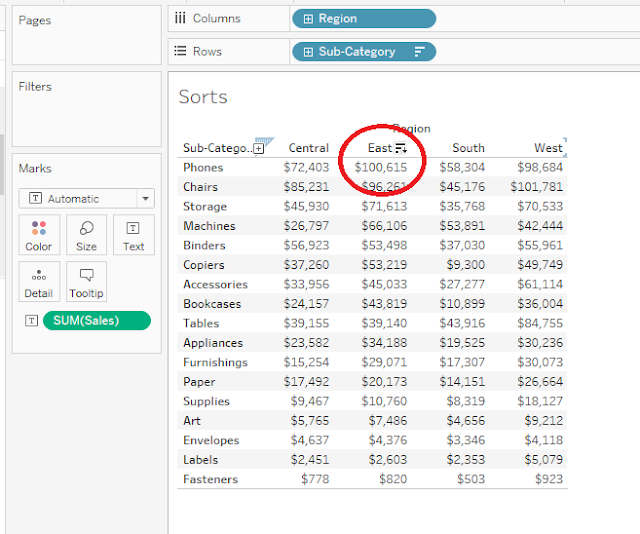
Pull ‘Sales’ onto Columns, ‘Sub-Category’ on Rows. Database used is Sample Super Store and Tableau 10.3
Pull ‘Sales’ onto Columns, ‘Sub-Category’ on Rows. Database used is Sample Super Store and Tableau 10.3
- Let’s Create a group of Sub-Categories which are performing low.
· Click on Control, Select ‘Art,
Envelopes, Fasteners, Labels and Supplies’. Release the Control and you can see
the ‘Paperclip’ Icon. Click on it, a new group is created. You can name it as ‘Small
Offices’, using ‘Edit Alias’ (Right Click on the group)

· Note: Creating
a group brings down the performance of the dashboard as it increases the
redundancy of the data.
- You can observe that ‘Sub- category (group)’ is created even though there is Sub-Category field. This duplicates the data and reduces the performance highly.

· Note: Difference between Groups and Sets: Groups can
be created on both Measures and Dimensions whereas Sets can only be created on
Dimensions. Sets are specifically designed to understand the nature and pattern
of the Dimensions.
· Note: Groups
can be created using Calculated Fields whereas Sets can’t be created using
Calculated Fields
· Sets can be used in calculated
Fields.
2 Let’s Create a group on Customer Name,
with name starting with letter A
· In Dimensions, Right click on
Customer Name, Create, Group.

- Manually Select the Names starting with Letter A, Click on Group. A group will be created. Name it as ‘Cust Names starting with Letter A’.
- Select the option ‘Include Others’. All the Customer names, which are not starting with A will be under Others as in pic below.
- You can also observe a new group (Customer Name(group)) is created in Dimension beneath Customer Name.

3 Visual Grouping
- Pull ‘Sales’ onto Columns, Pull ‘Category, Region and Sub-Category’ onto Rows. We have 1 measure and multiple Dimensions. Select all the ‘Sub-Categories’ in ‘Central’ Region. Click on ‘Group icon’, it will give us an option to choose All, Category, Region, Sub-Category.

- If we select Region in group. It will group on Central Region. A separate group for Central is created and the rest will be under Others. This is not recommended, as it highly reduces the performance as it will create duplicate data.
- In the same way, create groups for East, South, West Regions. Different colors will be assigned to each group.

4.
Groups On Geo Map
- Pull ‘State’ on the ‘Details’ Section of ‘Marks’ card. A ‘Symbol map’ with all States is shown.
- Select a set of states manually, Right Click on the particular selected state, Select ‘Group’. A new group is created. You can name it using ‘Edit Alias’. Create the groups, East, West, Central, South.
- You can use these groups in ‘Filter’. Pull the State(group) onto Filters and select ‘Show Quick Filter’.

5. Creating Groups using Calculated
Field.
· Let’s create a group with ‘States
starting with Letter A’.
· Create a ‘Calculated Field’. Name it
as ‘States start with A’ and give the formula
IF Left (State,1) = “A”
THEN “States Starting with Letter A”
ELSE “Other”
END

· Pull ‘State starts with A’ and State
onto Rows as in above pic.
· You can observe the groups created
using Calculated field have a prefix “=”
· Whereas the groups created manually
have a prefix of paperclip.
Note: It’s better to create a group using
Calculated field than manually, as the data is replicated when created manually
and brings down the performance.

Comments
Post a Comment